


Design team: Adrian Galvin [design], Jeff Brewer [CS], Pooja Nair [design]
10 week project.
GRAIN enables scientists to visually and interactively explore samples of granular materials as they are being deformed under stress. The software has affordances for exploration across multiple levels of scale and solves hard problems of occlusion and surface rendering of large numbers of 3D objects.
GRAIN allows scientists access to never before seen patterns, dynamics, and relationships in critical materials science research at the CalTech Computational Geomechanics laboratory.


The Mission
CalTech’s Computational Geomechanics lab works to understand, model, simulate, and make concrete predictions about complex mechanical systems. Their research has wide application from NASA’s Mars Science Laboratory drilling, to construction, to pharmaceutical manufacturing.
We were asked to help on a branch of their research which focuses on understanding how and why granular materials such as sand and pebbles fail under stress. The team has published clear visualizations of the 2D dynamics of granular material failure, but have been unable to visualize in 3D, which prevents further research and investigation.
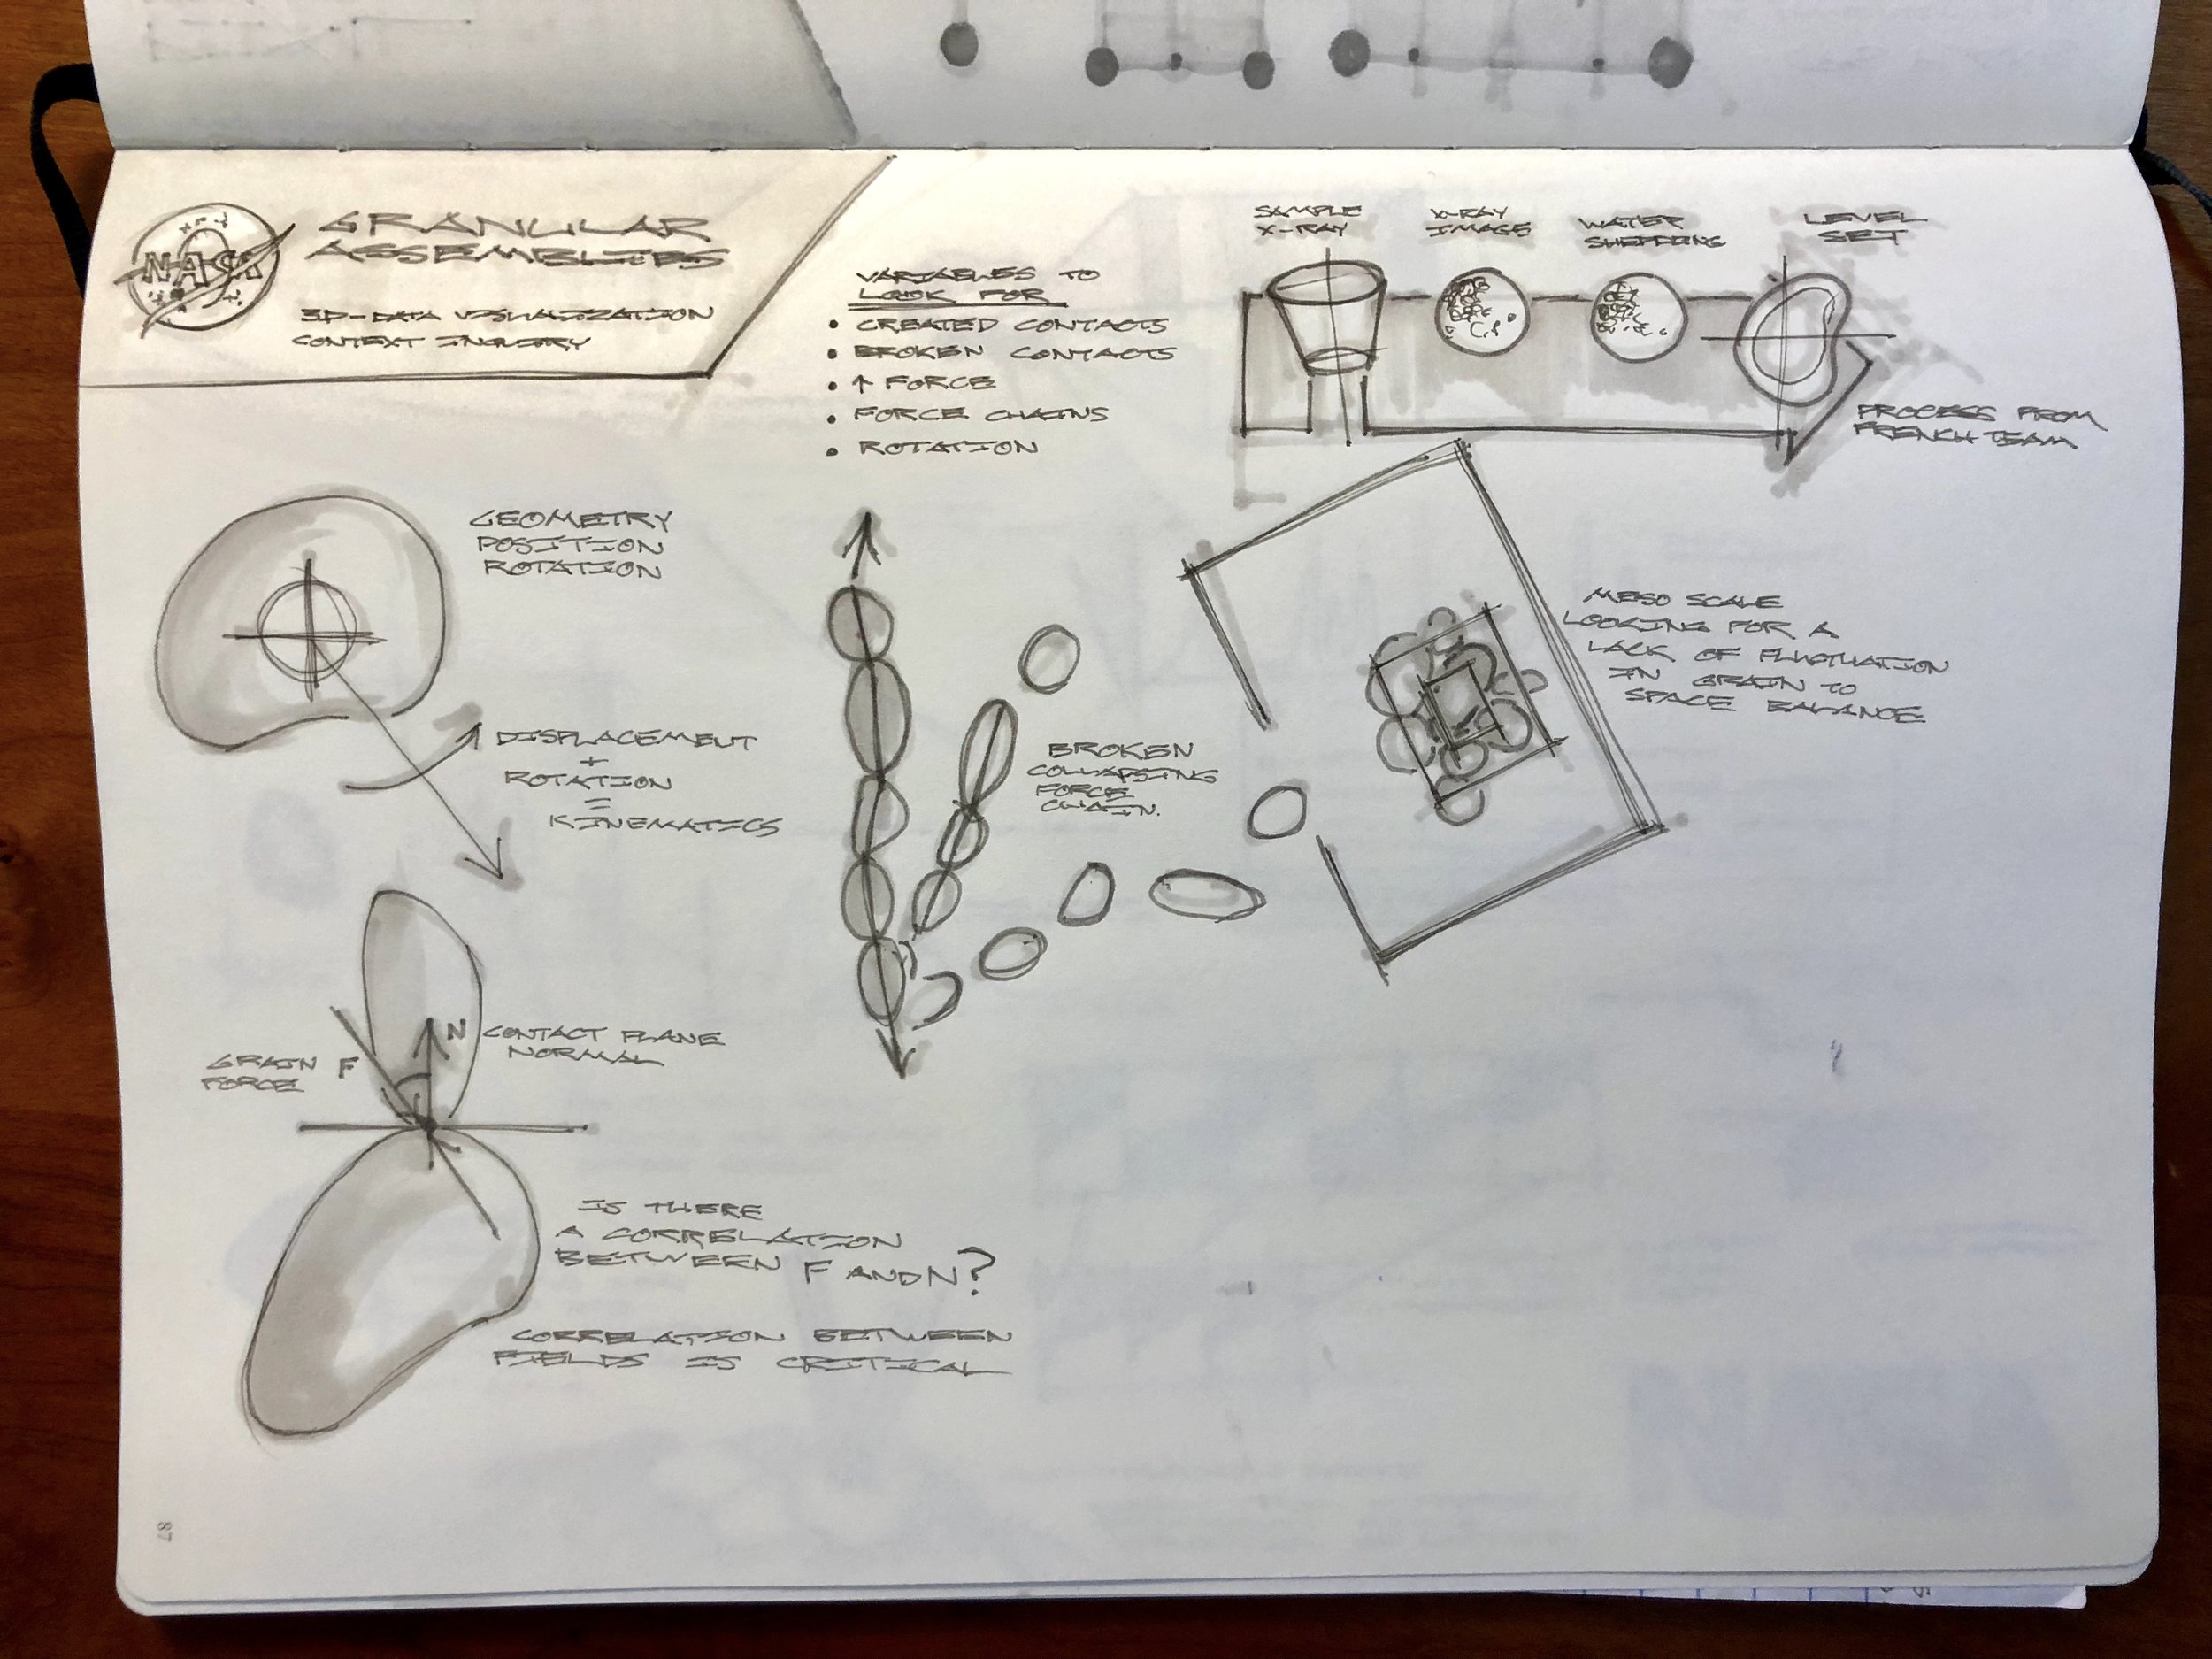
The team has computational models of 3D experiments which include between 50,000 and 70,000 individual grains of sand, how they move, what their surfaces look like, and the forces that they experience over time. This data was produced by x-ray lithography of cylindrical samples being crushed.
The problem is that the team is unable to investigate this valuable data base because of information overload and occlusion. When rendering 3D surfaces, the outer grains obscure the rest of the sample, and hide the internal dynamics of the grains. But the surfaces must be rendered because they provide critical information about how the grains are moving.
Our team’s task was to discover which visual aspects of the data were most critical, and design a way to flexibly foreground this information, while taking on a serious 3D rendering problem.


Computational Modeling Challenges
The team generates highly detailed information about the evolution of a granular sample using X-ray lithography. This data is used to generate simulations of grain scale mechanics and can describe macro scale events extremely accurately.
Having a clear grasp on the concepts and challenges was critical to establish before we could begin our work. We began by listening and asking questions of the team, zeroing in on their main pain points:
Inability to see complex interactions at multiple levels of scale simultaneously.
Unable to achieve interactive visualizations
Inefficient rendering pipeline
Critical dynamics are occluded by the data itself


Science Concepts
To start, we used sketches as boundary objects to capture the most important concepts and dynamics that the team was dealing with. Scientists have extremely deep knowledge in their field, and we were never going to achieve that level of understanding. But we could help the scientists prioritize the most important aspects of their research through sketching and discussion.
Their work centers around force chains. Granular materials are unique in that when a force is applied to them, the vast majority of the force is channeled through an extreme minority of the individual grains. They hypothesize that if they could see and deeply investigate the dynamics of these structures, they could make critical discoveries for the whole field.

Data Challenges
Our first hurdle was to ingest the data and produce 3D surface models of each grain. Jeff Brewer parsed the data in python and used webGL to render our first views of the grains. However, rendering all 60,000 grains at this level of detail was prohibitively taxing, so he used mesh lab to decimate the surfaces, producing a visualization that provided all the necessary information at 10% of the processing cost.


Visual Form Experiments
Through physical and computational sketching, we hypothesized about what forms and visual variables would most effectively map to different aspects of the data. We began to see which variables would reveal information at the level of the sample, and at the level of individual grains. We developed a cooperative, iterative process to see as many forms as possible.
This lead us in two key directions: surface rendering and kinematic abstraction.


Surface Rendering
Jeff worked tirelessly to build visualizations of all of the grain surfaces. This required enormous work in optimization. This visual pathway allows for great detail in seeing the form of each grain and how it is moving in relationship to other grains. However, it creates an occlusion problem in which external grains, which tend to be less important, are covering the interior of the sample. In order to address this problem, we developed dynamic opacity filters which were mapped to the amount of force that a grain was experiencing. We hypothesized that this would show the scientists only the most important grains at each time step.


Kinematic Abstraction
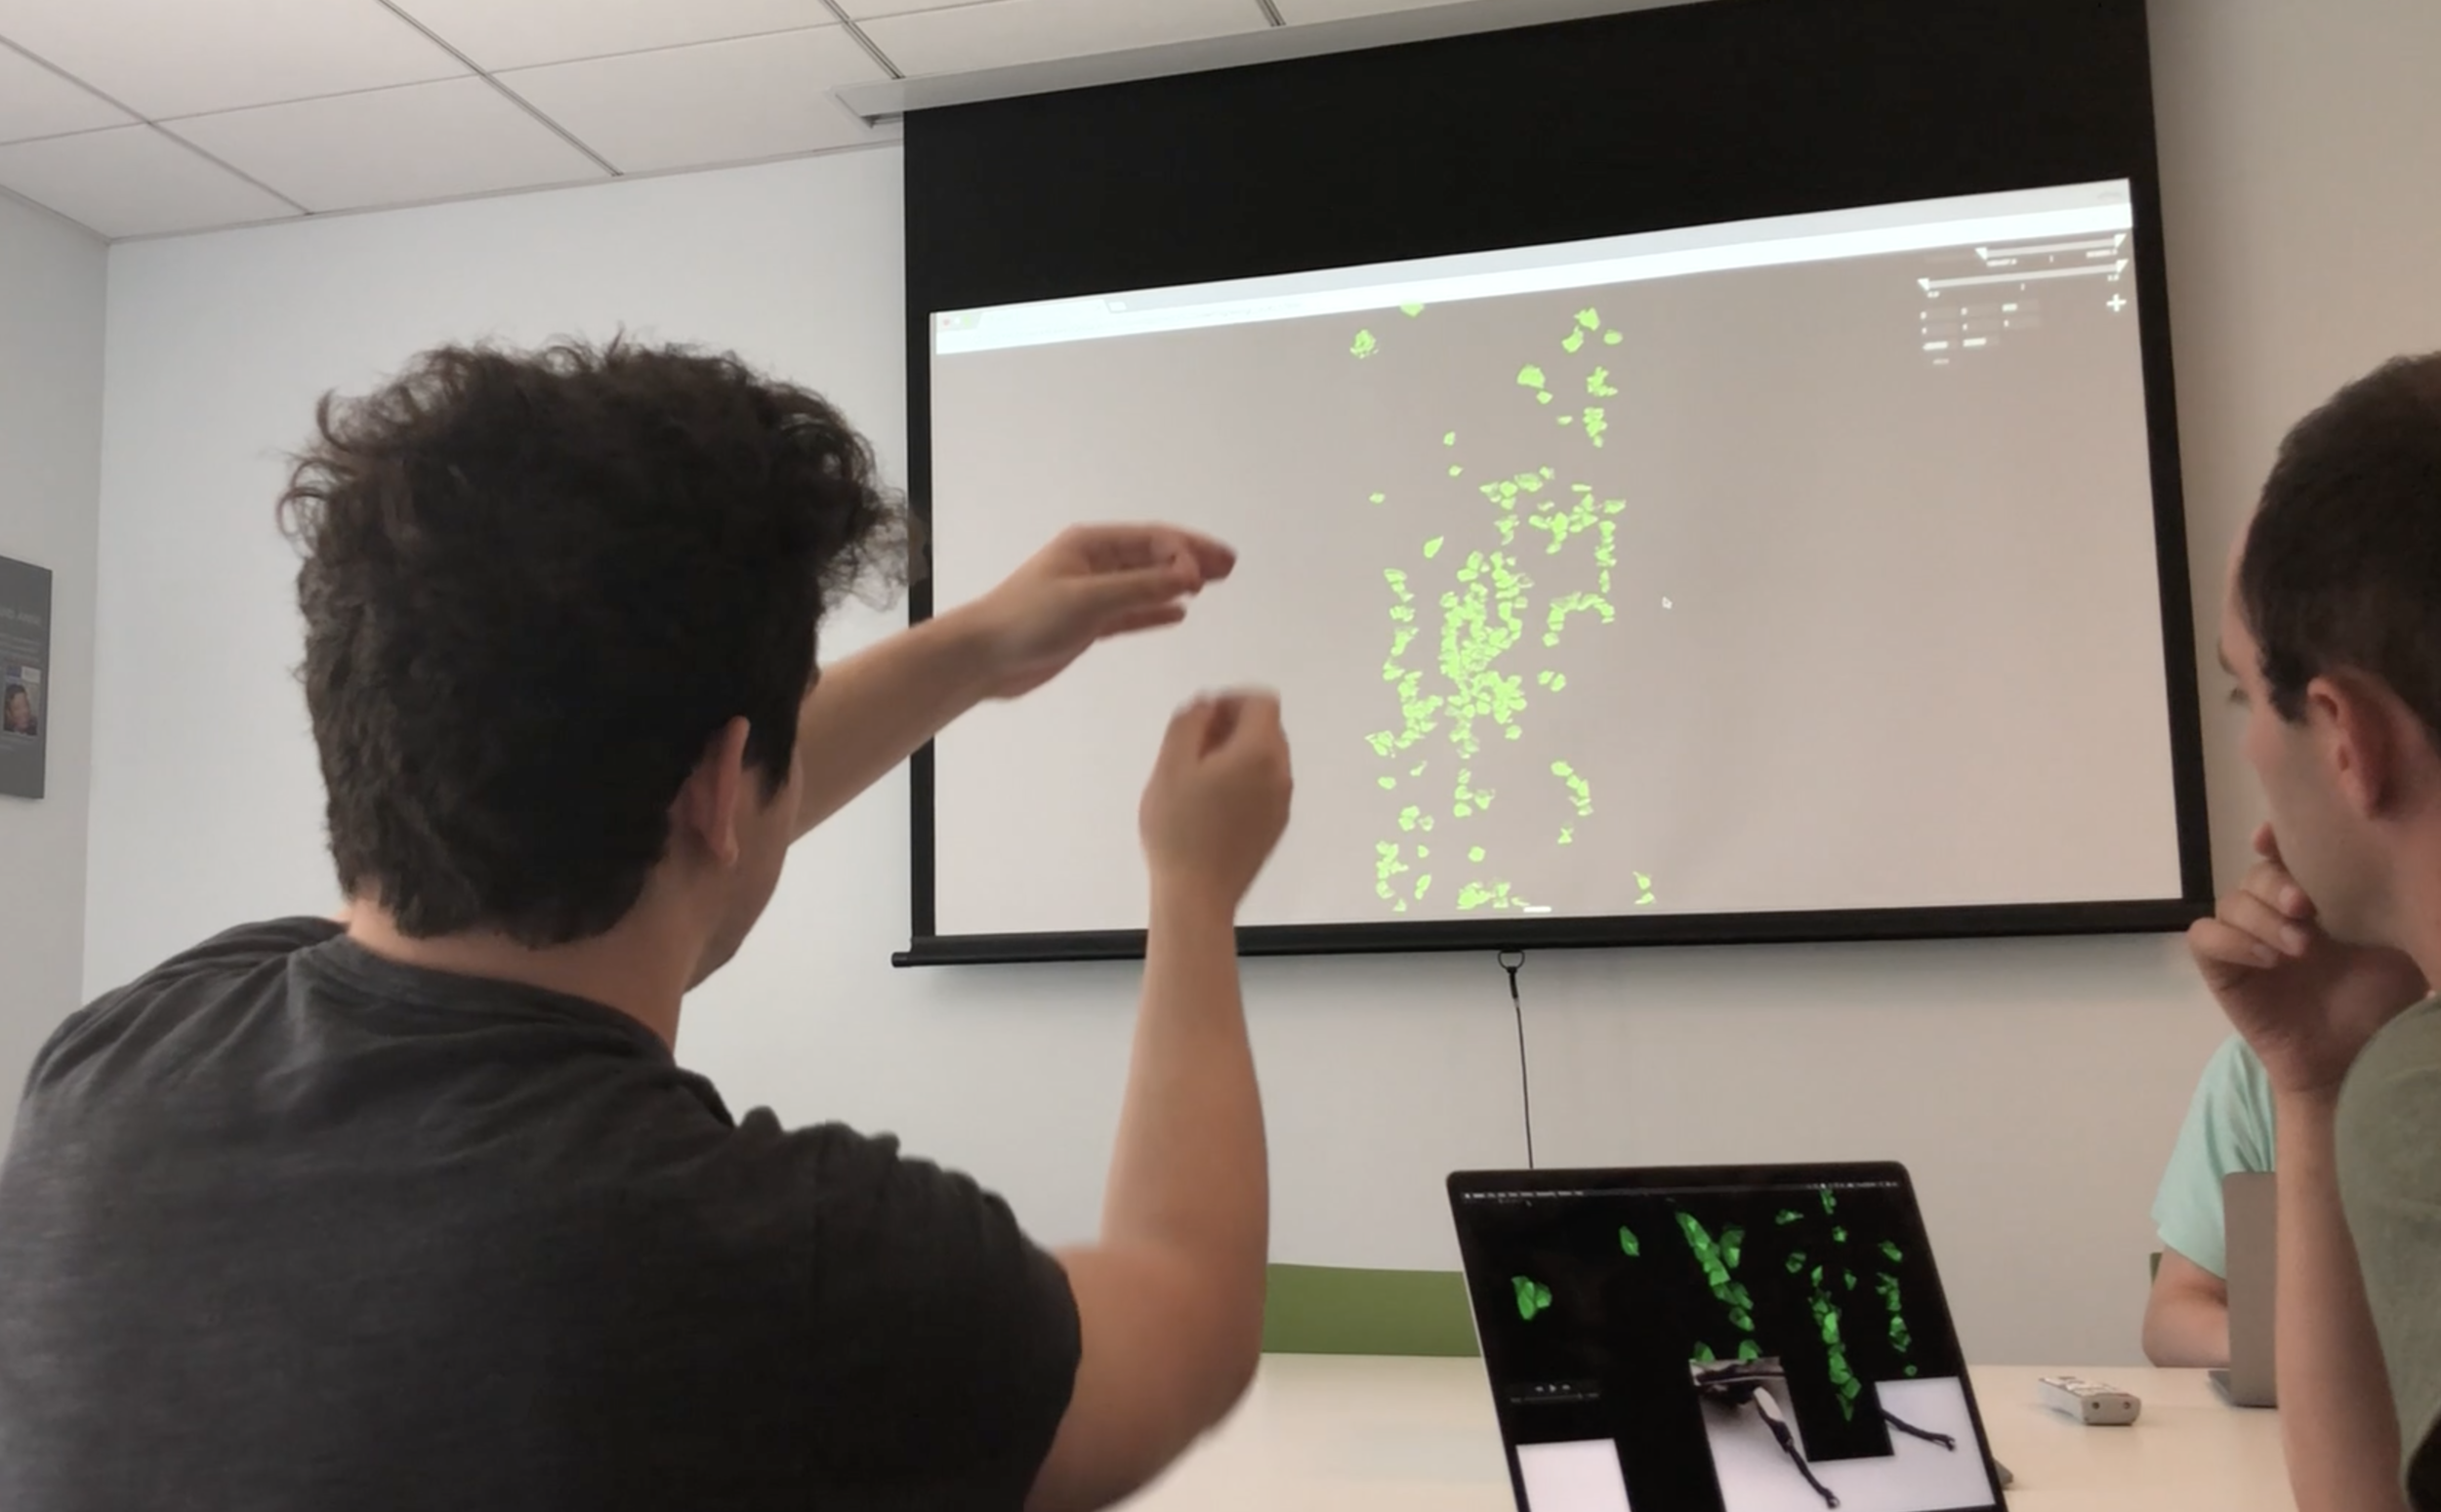
The second major direction that we investigated involved seeing one variable a the sample level in a dynamic abstraction. The above visualizations show contact forces and grain centroid position evolution represented as lines. These visualizations obviated the need for surface rendering and allow the researcher to see one data variable across the whole sample.
Our next step was to develop an interface and set of prototypes to show our science partners so that they could describe what they saw, and tell us the most valuable direction to go in.


Interface Ideation and Fortuitous Inspiration
We wanted to combine three dynamics from existing software interaction paradigms:
The detailed visual tuning of Adobe After Effects and Photoshop
The multi-scale visualization of Kitware Paraview
The flexible camera dynamics of Unity
By chance, as I was creating video content for testing, I noticed that my Macbook Pro was creating tiled visualization of each time step of the video that I was editing. This lead to an idea: could we include a similar form which would allow researchers to see a critical group of grains at every time step, emphasizing change over time without requiring the researcher to view the video on endless loop. We decided to include small multiples visualization in the interface.

Seeing Our First Force Chains
Using Jeff’s surface renderings, I carefully pulled out looped videos of individual force chains forming and dissolving. It seemed like we were close to our goal.


Challenging Assumptions
To present our ideas to the team, we used a unique hybrid prototyping approach which foregrounded the data, and helped the scientists describe their needs to us.
In data visualization, it is critical to use real data for prototype assessment, even in the initial phases of testing. However this presents a challenge, since creating multiple fully implemented interfaces would be prohibitively time consuming.
To get around this problem, we used mixed fidelity prototypes in which Jeff would run the data visualization on his computer, and we would skype his visualization onto the testing computer to combine it with temporary digital and paper interfaces.
Key takeaway: Surface renderings, even with opacity filters do not reveal anything novel or of critical interest to the scientists.
This was a critical success and a demonstration of the value of prototyping early. Creating the surface visualizations was extremely challenging, and once we heard from the scientists that it was the wrong direction, we were able to focus our time on the most useful directions: small multiples and kinematic abstractions.


Final Visualization Directions
We further developed the kinematic abstraction visualizations, and repurposed the surface rendering capabilities that Jeff had developed by applying them to a small multiples visualization. This also supported the scientists need to work across multiple scales of investigation.


Thank you
CalTech Computational Geomechanics team. Jeff and Pooja. The JPL/ArtCenter/CalTech mentor team.
Photo credit : Caltech-JPL-Art Center Visualization Program / Andrade Laboratory